 [Stata] 우리나라 covid-19 확진자 현황
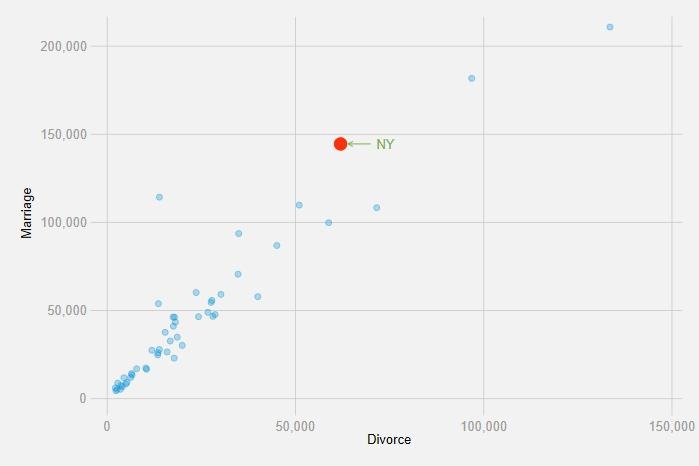
우리나라 지역별 확진자 현황을 Stata로 그려보았다. 지역별로 확진자 10명이 나온 시점을 기점으로 하여 정규화 시켰다. 그림이 명확하게 보여주듯이 다른 지역은 대체적으로 안정세로 접어들고 있지만 서울과 경기도는 여전히 달리고 있는 중이다. 한 가지 특이사항은 인천도 뒤늦게 달리기에 뛰어 들었다. 동태적인 변화를 살펴보기 위해 아래와 같은 그림을 다시 그려보았다. 가로축은 규모이고, 세로축은 변화량이다. 두 변수다 로그-변환을 했고, 세로축은 4기 이동평균을 이용하였다. 그림을 살펴보면, 위의 그림과 유사한 결과를 얻을 수 있는데, 대구와 경북은 상당히 높은 확진자수까지 같은나, 신규 확진자 규모는 대단히 빠르게 줄어들고 있다. 이와 같은 패턴은 국가간 비교 중 중국/한국이 보여주고 있는 패턴과 동일하..
 [Stata] covid19 현황 그리기
Stata의 Chuck Huber가 만들어 놓은 존스홉킨스대학의 깃헙 자료를 읽어들여 자료를 정리하고, 최근 covid19 관련 확진자를 시각화하는 do 파일을 작성하였습니다. 먼저, Chuck 의 파일을 이용해 Github 자료를 불러들입시다. local URL = "https://raw.githubusercontent.com/CSSEGISandData/COVID-19/master/csse_covid_19_data/csse_covid_19_daily_reports/" forvalues month = 1/12 { forvalues day = 1/31 { local month = string(`month', "%02.0f") local day = string(`day', "%02.0f") l..
https://youtu.be/-BGK7U_-9lA

https://youtu.be/hE7V5huBfUM
https://youtu.be/qdl0ne0JdWU
 [Stata] 숫자 변수명으로 된 것을 long-form으로 전환하기
Stata에서 변수이름으로 숫자를 쓸 수가 없다. R에서는 가능하다. 그래서 첨부된 파일과 같이 연도가 가로로 되어 있는 자료는 다루기 어렵다. 그래서 아래와 같이 long-form 으로 전환할 수 있다. clear import excel using fertility.xlsx, clear foreach j of var B-T { local name = strtoname(`j'[1]) capture rename `j' `name' } drop in 1 rename A region rename _* fer* reshape long fer, i(region) j(year) destring fer, replace egen id = group(region) order id year xtset id year xtl..

 [R] 구글 트렌드를 이용한 조국 검색 결과
구글 트렌드 자료는 아래와 같이 정의된다. 구글에 검색 요청이 들어왔던 자료를 정규화 시켜 놓은 것이다. FAQ about Google Trends data Google Trends provides access to a largely unfiltered sample of actual search requests made to Google. It’s anonymized (no one is personally identified), categorized (determining the topic for a search query) and aggregated (grouped together). This allows us to display interest in a particular topic from arou..
